


K12 Data Dashboards
Visualize data, make better decisions
K12 Data Dashboards
Visualize data, make better decisions

Data Dashboards
As a provider of dashboard solutions, our company specializes in developing customized visualizations that have a significant impact on education systems. With extensive knowledge of K12 data sources and hands-on experience collaborating with the education community - including teachers, principals, district leaders, and superintendents - we are able to create highly effective data representations that cater to the unique needs of each school system.
Our services are available to school districts of all sizes throughout the country. We have a proven track record of working with large, mid-sized, and small districts, and our solutions are designed to meet the specific requirements of each client. If you're looking for a dashboard solution that can improve the performance of your district, we are confident that we can help you achieve your goals.
View Live Example
backend data work
Our company handles the backend data integration necessary for automated updates of data dashboards, eliminating the need for manual updates.
Through our advanced data processing and storage systems, we implement a reliable and scalable architecture that supports real-time data ingestion and processing.
Our solutions ensure the accuracy and consistency of data, enabling seamless updates of data dashboards without requiring any manual intervention.
rapid development
In addition to utilizing Tableau technology, our platform incorporates a range of other cutting-edge tools and technologies to deliver the best results for our clients. We employ Extract, Transform, and Load (ETL) technology to enable efficient data integration, processing, and storage, ensuring that our data visualizations are up-to-date and accurate.
We work with various databases to accommodate the diverse needs of our clients. Our development cycle is designed to be fast and agile, allowing us to rapidly prototype and deploy new features and improvements to our platform, ensuring that our clients have access to the latest and greatest in data visualization technology.
Training program
Our company specializes in developing professional development programs that empower educators and administrators to become proficient in data analysis and interpretation, enabling them to make data-informed decisions that improve student outcomes and drive organizational growth.
Our programs are tailored to the specific needs of education systems and are designed to be both practical and engaging, providing hands-on training in data analysis, visualization, and interpretation. We also cover topics such as data governance and ethical considerations, ensuring that participants are equipped with the knowledge and skills necessary to navigate the complex data landscape in education.
Our experienced instructors are dedicated to ensuring that our programs are relevant and up-to-date, incorporating the latest industry standards and best practices. By completing our professional development programs, educators and administrators will be better equipped to leverage data insights to improve teaching and learning outcomes, while also driving organizational growth and innovation.
Attendance Dashboards
Connect to your SIS and pinpoint opportunities for improvement
Attendance Dashboards
Connect to your SIS and pinpoint opportunities for improvement
Attendance Video
Attendance data
Improve your Student Information System (SIS) capabilities by connecting it to our dashboard system for attendance analysis. Our comprehensive dashboard system enables large and small school districts to efficiently monitor student attendance and analyze trends based on district, region, school, grade level, or any available demographic variable. Our system is highly compatible and there are no known technical limitations between our dashboard system and any SIS.
HISTORICAL DATA
We understand that historical data analysis is crucial for school districts, and our dashboard system allows for deep analysis without interrupting the analytic flow of the end user. With our system, historical data is readily available and can be accessed by the end user with a single click. This allows for a more complete understanding of student attendance patterns and trends, empowering schools to provide better support for their students.
Our system has received positive feedback from clients, who have reported significant improvements in their ability to support their students based on a more complete understanding of their attendance patterns. With our system, school districts can unlock the full potential of their SIS and make more informed decisions based on historical and current data.
granular and aggregate
Our dashboard system offers robust granular and aggregate attendance data analysis capabilities, enabling school districts to conduct detailed analysis of attendance patterns. To achieve this, we leverage automated data export processes that transfer granular attendance data from the SIS to our dashboard system each night.
This granular data is then used to aggregate attendance data by various dimensions such as district, school, grade level, gender, ethnicity, race, economic status, SPED status, ELL status, and other available demographic variables. Additionally, our system provides dis-aggregation capabilities that allow for the analysis of attendance data at the individual student level, enabling administrators to gain insights into specific students' attendance patterns.
To ensure the relevance and usefulness of the data, we develop custom logic to visually identify data points that require attention based on district-defined thresholds. For example, we can set up our system to display warning colors for attendance data that falls below a certain threshold, enabling administrators to quickly identify areas that require improvement.
Our system is highly scalable, capable of processing large volumes of attendance data, ranging from tens of thousands to over 40 million rows, with fully automated processes that update the dashboard system each day. Overall, our granular and aggregate attendance data analysis capabilities provide school districts with the insights they need to make informed decisions and take proactive measures to support student success.
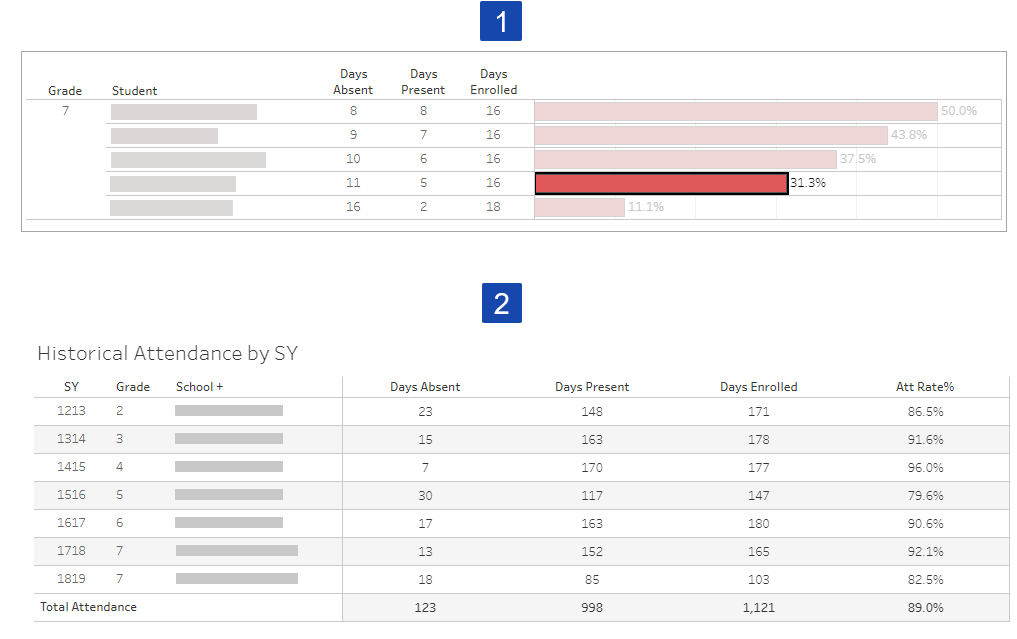
Attendance Dashboard Example
In this example, we have selected the month of February, which triggers the dashboard system to display attendance data for that month broken down by grade level. By clicking on a specific grade level, the dashboard system then reveals the names of students in that grade along with their corresponding attendance information for the selected time period. This allows school and district administrators to quickly drill down to the individual student level and gain insights into specific attendance patterns.

Features
Allows for ongoing attendance monitoring
Compares point-in-time historical attendance comparisons (YTD or any week)
Allows for dynamic sub-group attendance monitoring with few clicks
Color coding used to read warning levels at a glance
Allows for easy to read grade level attendance analysis
Drills down to individual students
Filters down to groups of students in need of attendance improvement
Historical Analysis
When analyzing current attendance data for a student, access to their historical attendance information is just a click away. The first step involves reviewing the student's attendance data for any point in time within the current school year. With a single click, the second step is executed and the dashboard system displays the student's historical attendance records, allowing for deeper analysis and a more complete understanding of attendance patterns.
Assessment Dashboards
Learn what the data is saying about your students
Assessment Dashboards
Learn what the data is saying about your students
Cohort Analysis
Utilize your district's Student Information System (SIS) to track and monitor student cohorts. Analyze cohort trends in assessments, attendance, behavior, and grades to adjust and refine support strategies as necessary throughout the academic year. By monitoring cohort data, you can make informed decisions about interventions and supports, and track progress towards academic goals. This enables you to proactively address any issues and continuously improve outcomes for your students.
Student Growth
The systematic analysis of student growth plays a critical role in driving the continuous improvement process in any school system. By leveraging existing formative assessment systems, we can create an integrated growth measurement tool that facilitates the analysis of student growth over time, allowing for more accurate and comprehensive evaluations of student progress. This tool can be used to inform instructional decisions, support targeted interventions, and improve overall student outcomes.
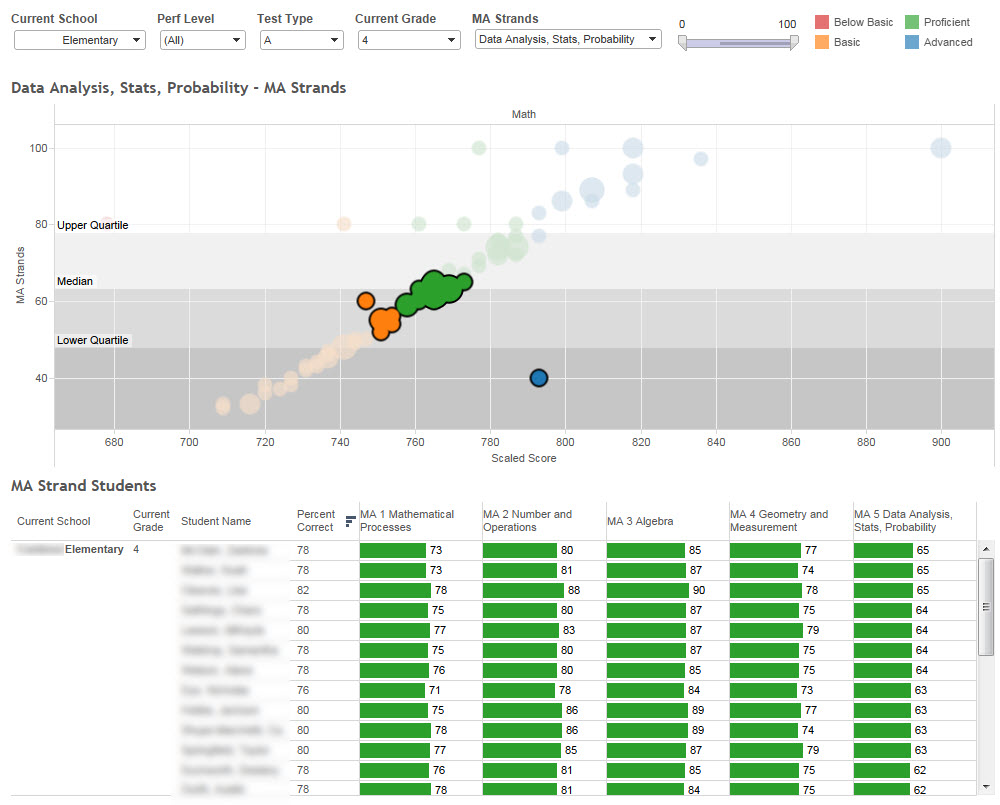
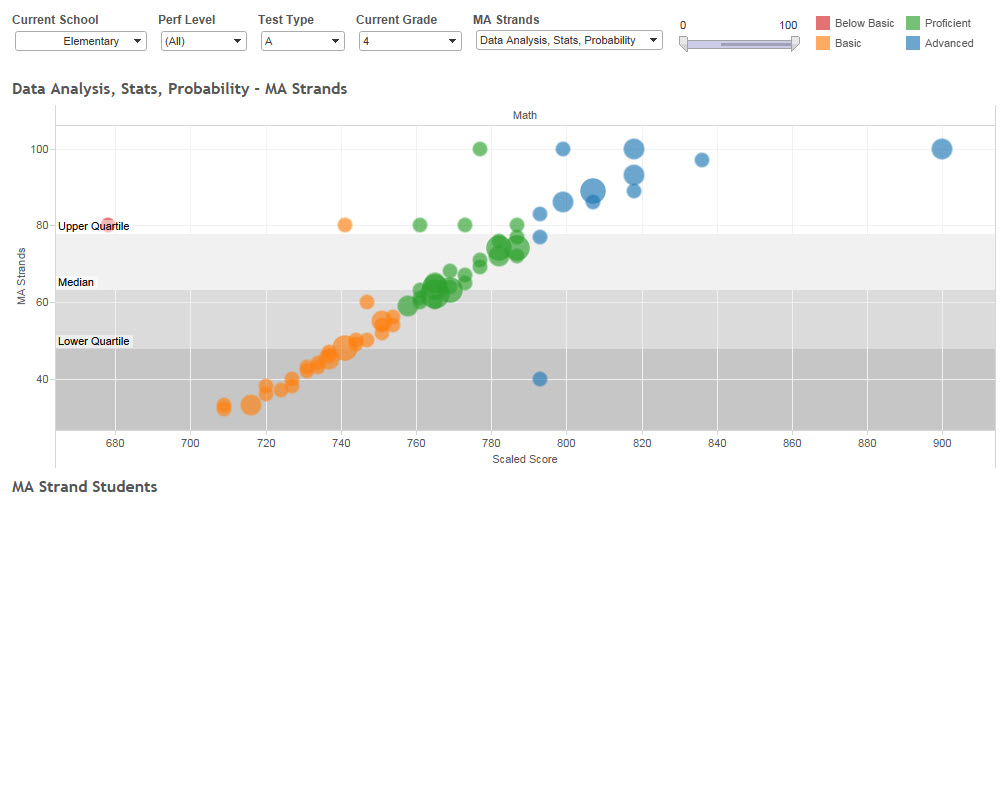
Strand/Claim Analysis
Analyzing student performance data by overall achievement is a practice used by all districts and schools. The same data can be analyzed at a deeper level by changing the analysis to strand/claim data. Instead of providing supports for students by overall performance levels, they can be aligned by strand/claim performance. Strand/claim performance analysis allows schools to align supports for the individual needs of students regardless of overall performance levels.
An "Advanced" student might benefit from the same support that a "Below Basic" student receives if they both perform in a similar way on an individual strand/claim (i.e. data analysis and probability). Alternatively, a student at the "Below Basic" level might not need all of the supports for a subject if their strand/claim performance in one area is strong as suggested by strand/claim data (the time can be used more efficiently).
Test Management
Efficient management of testing events is a critical factor in ensuring the fidelity of implementation in a school district. Our solution enables you to increase testing rates by closely monitoring assessment events across the district, school, subject, or grade level, thus ensuring comprehensive test coverage. By utilizing our platform's advanced analytics and reporting capabilities, you can gain insights into testing trends, analyze the performance of individual students, and take appropriate measures to address any issues that arise. Our solution provides a comprehensive testing management system that allows administrators to monitor and optimize testing events and ensure the accuracy and reliability of test results.
Hundreds of Designs and Counting
Over the years, our team has developed a multitude of assessment dashboards for various school districts. Our dashboard designs are frequently influenced by emerging district needs as well as changes in the testing landscape. Variables such as changing enrollments, district initiatives, and student performance may necessitate a new focus in dashboard development. As a team, we remain dedicated to exploring innovative techniques for connecting and visualizing student data. We embrace the opportunity to tackle new development challenges and continuously strive to exceed the expectations of our clients.
If we have yet to create an assessment dashboard for a specific requirement, we would be delighted to develop one for you. Our team is committed to providing customized solutions tailored to the unique needs of each district.
Behavior Dashboards
A smarter way to manage and analyze behavior data
Behavior Dashboards
A smarter way to manage and analyze behavior data
YTD Incidents
Maintain a comprehensive record of all behavior incidents that occur in your school or district. Analyzing the frequency and patterns of these incidents can help administrators identify both positive and negative trends in student behavior, allowing for the implementation of appropriate strategies and interventions to support student success.
top n infractions
Each school's culture and climate are distinct, thus the tools utilized to monitor student behavior should be customized accordingly. The generation of a top N infraction list for a specific school or district can be fully automated for all administrative teams. This list can be updated each day by using data from the Student Information System (SIS).
historical behavior
Accessing historical data is essential to understand the behavior of students and developing appropriate interventions. Our system allows easy access to the rich historical view of students' behavior with one click. It enables educational professionals to retrieve and analyze data on behavior incidents from the past, thereby enabling them to identify patterns and trends that can inform current decision-making.
Using this feature, it is possible to develop a comprehensive behavior improvement program for students. Historical behavior data helps to identify the underlying factors that contribute to a student's behavior and develop strategies that target those factors. This approach allows for a more personalized and effective approach to behavior support and helps to improve outcomes for all students.

Grade Dashboards
Analyze performance trends in the classroom
Grade Dashboards
Analyze performance trends in the classroom
Student Grades
tudent grades captured by a student information system (SIS) are a valuable source of information for monitoring and improving student performance. It is important to analyze grade data frequently to identify trends and patterns in student performance, as it can provide insights into student understanding of course material and overall academic progress.
Through the use of an SIS, schools and districts can capture and archive student grade data, providing a rich source of information for analysis. By monitoring student grades, educators can identify students who may be struggling academically and intervene early to provide additional support. This can help to prevent students from falling behind and increase the likelihood of success.
Furthermore, analyzing grade data can help identify areas where teachers may need additional support or professional development. For example, if a large number of students are performing poorly in a particular subject or course, it may indicate that the curriculum or instruction needs to be adjusted.
In addition to identifying areas for improvement, analyzing grade data can also provide valuable insights into student achievement over time. By tracking changes in student grades from one semester or school year to the next, educators can determine if their intervention strategies are effective and make necessary adjustments to improve student outcomes.
Overall, the analysis of student grades captured by an SIS is a critical component of the continuous improvement process in education. It provides a wealth of information that can inform decisions related to student support, instructional practices, and overall school or district improvement efforts.
Our work in this area has led to a number of improvements in grade management:
Identification of high failing courses by teacher well before final grades are posted
Ongoing data cleanup by pinpointing missing grades in the SIS
A better understanding of cohort performance in every course
Analysis of correlations between classroom student grade performance and standardized tests
Auditing of senior graduation requirements using current and historical grades
Pinpoint Struggling Students
Student grade dashboards enable practitioners to quickly identify courses where high percentages of students are failing by using intuitive controls similar to those used in online airline ticket purchases. These dashboards are essential for timely intervention and providing targeted support to struggling students and teachers. By identifying struggling courses early, educators can use data-informed decision-making to develop effective strategies for improving academic outcomes. This can lead to improved student engagement, increased retention rates, and higher achievement levels for all students.
Example:
Changing a slider to show courses where a percentage (30%) of the students or higher are earning D's or F's:


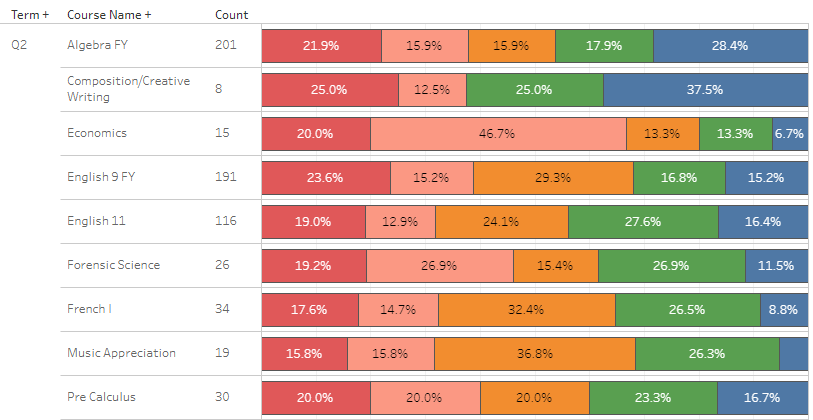
Takeaways from this data example:
21.9% of the students earning F, 15.9% earning D, 28.4% earning A in Algebra FY (37.8% failing will cause students to retake course)
31.9% of students are failing English 11, a required course for graduation
66.7% of Economics students earning D or F
In K12 education, auditing student grades can be challenging due to the presentation of grading distribution data in an aggregate format. Without access to underlying student data, analyzing trends across students, courses, or teachers becomes difficult. Our student grade dashboards provide the necessary tools to address these challenges and improve the utilization of grading data. These dashboards allow for easy identification of struggling courses and students, which is crucial for providing targeted support and interventions. With our dashboard design, practitioners can quickly and accurately analyze grading data and identify trends in student performance, helping to improve overall academic outcomes.
Cohort Analysis
Our dashboards have been developed to allow for the analysis of student cohorts in specific courses, in comparison to their overall academic performance. This allows educators to identify courses in which a significant percentage of students are struggling, compared to their performance in other courses. It is not uncommon to find courses in which a large proportion of students are underperforming, despite doing well in other courses. Our dashboard system enables educators to identify these trends early on, and implement targeted interventions to support struggling students.
Historical Grades
The federal government mandates districts to store student grades in their SIS. However, this data is often not readily available to school leaders in a format that can be easily analyzed. Our dashboard system design includes a process that extracts all historical grades as far back as your system allows. We have successfully extracted up to 21 years of student grade data to ensure all of the various types of students enrolled in the district have historical data available.
Why is it important to have access to such an extensive amount of historical data? Historical grades are integrated into a student's profile. When analyzing grades for a current term and viewing a student's record, all historical data becomes available with one additional click. This allows a practitioner to review a student's grade performance over multiple years of instruction. For instance, a student that struggles in Algebra I may have had difficulties in mathematics since grade 1. Without a comprehensive dashboard system, it would be impossible to review and analyze these types of data patterns.
Geolocation Dashboards
Improve student services by understanding the landscape
Geolocation Dashboards
Improve student services by understanding the landscape
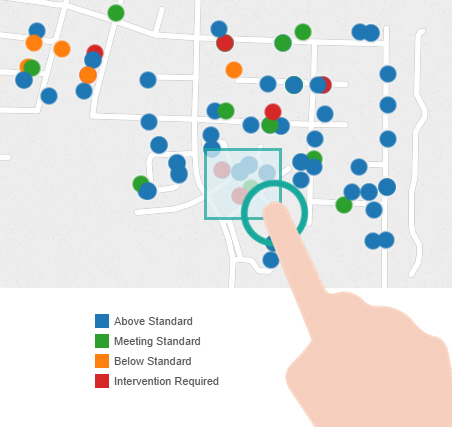
GEOLOCATION DATA
By connecting geolocation data to various data sets within a school district, educators and administrators can gain valuable insights and make informed decisions. For example, mapping student data can help with identifying trends and patterns in student performance based on their location. This can be particularly useful for districts where students from different areas may have different access to resources and opportunities. By mapping out this information, administrators can make more informed decisions about resource allocation and other interventions.
Additionally, mapping employee data can help with understanding how school staff are distributed across the district. This can help with identifying areas where additional staffing may be needed, or where staff members may be overworked and in need of support. Mapping bus routes can also be helpful in identifying areas where students may be experiencing longer commutes or facing other transportation challenges.
Overall, mapping data can provide a powerful tool for educators and administrators to gain a better understanding of the distribution of resources and opportunities across the district, and to identify areas where targeted interventions may be needed.
Teacher Observation Dashboards
Align your professional development offerings to teacher needs
Teacher Observation Dashboards
Align your professional development offerings to teacher needs
OBSERVATION MANAGEMENT
The process of extracting teacher observation data can be complex and time-consuming, especially when it comes to ensuring compliance and timely follow-ups. With our observation dashboard system, you can streamline this process and make it more efficient.
Our system is designed to be customizable and can be tailored to meet the specific needs and requirements of your school or district. We can connect to your teacher observation platform and extract all relevant data in real-time, allowing you to keep track of events as they occur and take action when necessary.
The observation dashboard system is designed to be easy to use and accessible to all district and school leaders. It provides a comprehensive view of teacher observation data, including compliance rates, performance trends, and areas for improvement.
In addition, the system can also help identify high-performing teachers and provide insights into best practices that can be shared across the district. By leveraging the power of teacher observation data, you can improve teacher performance, enhance student outcomes, and achieve your overall educational goals.
We have aligned to a number of focus areas:
Compliance of observation policy - (monitoring steps in observation process)
Observer Analysis
Teacher Analysis
Indicator Analysis
Alignment to Professional Development
Call or schedule a meeting with us to discuss your observation requirements.
Monitor observations by week / Observor

Common Features
At a glance monitoring of teacher observation data
Drill down capabilities (view underlying data for any observation)
Integration into third party custom observation platform
Allows for observation frequency monitoring
Ability to change to any school in a district (district level)
Serves as an early warning indicators for schools not meeting observation requirements
Ability to align professional development with teacher needs
Compliance issues
Never lose another observation event due to lost information or limited reporting.
Our dashboards can be scheduled to email daily so you never miss an early warning sign.
bad observations
Pinpoint and report erroneous data in the observation system to contribute to a continuous data cleanup effort.
Additional Dashboards / Services
In addition to the examples on our website, we offer visualizations and services in the following areas:
Student Profiles
Student Interventions
Student Activities
Student Retention / Promotion
District / School Demographics
Teacher Attendance (certified)
Employee Attendance (classified)
Teacher Lesson Plans
Budgeting
Human Resources
SIS Auditing
College and Career Readiness
Development of Survey Instruments
Data Collection
Secure Data Transfer
Covid-19 Tracking
Leadership Data Training
ETL Development
Executive Reporting (from data source to production print)
We integrate with any system that produces data.
Contact us to discuss your district's data dashboard needs.